
Geologic Modeling
| PROJECT NAME & LOCATION | DATE STARTED | DATE COMPLETED | |||||
| DSCP Groundwater Remediation Philadelphia, PA |
June, 2001 | July, 2010 |
| ACTIVITY TITLE | APPROXIMATE CONTRACT VALUE | |||
| Geologic & Groundwater Flow Modeling | ~700,000 |
| CLIENT NAME & ADDRESS | TECHNICAL CONTACT | |||
| Brian Blanchard / (215) 702-4066 Tetra Tech EC, Inc. / Langhorne, PA Brian.Blanchard@tteci.com |
DESC / Hasan Dogrul / hasananddebbie@aol.com TTEC / Derek Pinkham / (215) 702-4070 Derek.Pinkham@tteci.com |
Digitized sewers and attributes from city drawings over aerial photo where line color marks sewer diameters.
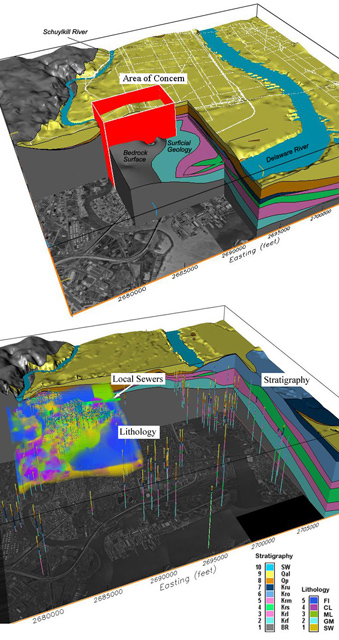
The Defense Energy Support Center (DESC), in collaboration with Tetra Tech EC, contracted the GeoHydros modeling group to construct a comprehensive geological framework model (GFM) for the Defense Supply Center Philadelphia (DSCP) and use the model as the basis for groundwater flow and contaminant transport assessments. The primary purpose of the GFM is to synthesize disparate datasets describing the stratigraphy and lithology of the site and region into a consistent interpretation of hydrostratigraphic controls on groundwater flow and dissolved and free-phase contaminant movement.
We first developed a scalable database to manage all site and regional geologic and hydraulic data. We then used EarthVision™ to develop surface, isochore, and parameter grids to evaluate the trend of regional stratigraphic units relative to reported lithologic variation. We used a telescoping gridding technique to identify and preserve regional trends at the boundaries of higher-resolution site-scale grids. We then developed an iterative grid stacking routine to insure that both thicknesses and surface elevations were honored in the final model simulation. This was done by adding isochore grids to the lower bedrock surface, checking the resulting surface elevations against all non-fully penetrating boreholes, and then distributing any error into the underlying units.
We developed and used a probabilistic approach to simulate 26 soil/sediment types that were defined across the site and group them into 5 groups having similar hydraulic conductivity. Each group was defined by its presence or absence at each data point and then unit probability grids were developed for each unit. The grids were then compared on a node-by-node basis to arrive at a model of lithology marking the 3D distribution of the units by their respective probabilities.
Comparison of MIP & laboratory analytical data from 3D models sliced at a specific elevation
Spatial analysis of geophysical survey data related to key Site features and an aerial photograph.
3D distribution of FID in soils where VOC contaminantion is above the State-defined threshold
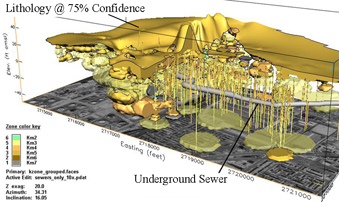
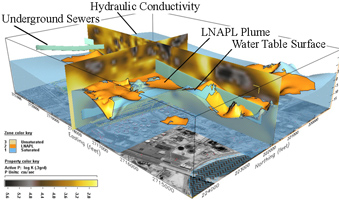
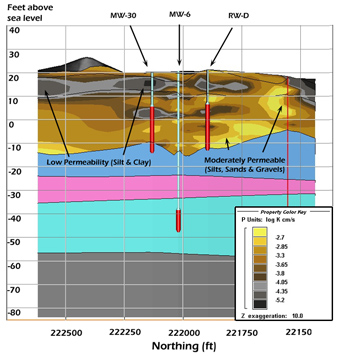
Confidence in the model simulation was defined by the distance to the closest data point. The probability model was then used to map hydraulic conductivity heterogeneity relative to underground structures and synoptic models of LNAPL morphology. Overall, the GFM consolidated data from more than 1000 wells & borings collected over more than 15 years, paper maps and CAD files describing underground structures, digital topographic maps and surveys, aerial imagery, and published geologic maps. Perspective views, x, y, and z slices, and cross-sections were compiled to document and explain the model-simulated geo-spatial relationships.
In 2009, work began on importing the stratigraphic and lithologic framework from EarthVision into FEFLOW. The regional stratigraphic horizons were imported directly to create the lower layers of the flow model. A program was written to assign the upper FEFLOW layers such that they intersect every lithologic contact described in the 3D grid resulting in a nearly perfect match between the conceptual and flow models. Both hydraulic conductivity and recharge in the flow model will be optimized to achieve a global calibration. Fate and transport modeling will then be performed to determine how dissolved-phase VOCs will migrate through the surficial aquifer away from the LNAPL and the extent to which contamination may travel vertically into a lower potable aquifer.
We have met or exceeded all project expectations. The expanded budget reflects additional modeling work requested to meet evolving project requirements. Our most significant problems stemmed from managing data inconsistencies and adapting to evolving objectives or limitations imposed by a litigation effort. We developed database comparison protocols to ensure that all database changes enacted by the litigation team are identified and appropriately addressed in the modeling database. We automated model development processes that have allowed us to rapidly rebuild the GFM and all relevant visualizations to accommodate new data and/or revised interpretations. We also adopted a milestone approach to modeling to allow for periodic review with the remediation and litigation teams and adopt course adjustments as necessary.