
Services
GeoHydros is primarily a modeling specialty firm that provides geologic modeling, 2D & 3D visualization, and hydrologic modeling services under subcontract to larger environmental engineering firms as well as federal, state, and local government agencies, and private clients. We typically perform these services in concert through what we call our Dual Modeling Approach™ wherein we use in-house software to link modeling programs and facilitate output development and web-based presentation. We have also developed highly specialized skills in GIS, database development, and karst aquifer characterization that we perform independently or in conjunction with modeling projects. Our proprietary post-processing modeling software allows us to deliver high quality modeling visualizations for almost any environmental project: $5,000 to $500,000 in scope.
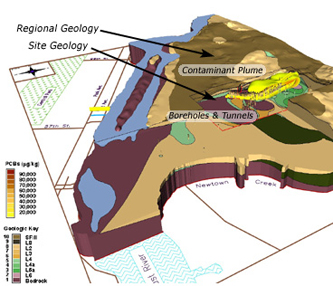
Regional & Site Conceptual Modeling
- More than 20 years experience in developing computer generated Geologic Framework Models (GFMs), sometimes called Conceptual Site Models (CSMs), and 2D and 3D visualizations of data and process modeling results.
- Synthesize geologic, hydraulic, contaminant, & structural data into highly visual, readily query-able models.
- We use EarthVision - the most sophisticated commercially available solids modeling and 3D visualization software.
- Extensive experience with the Structure Builder, Workflow Manager, Graphic Editor, Formula Processor, Minimum Tension surface and isochore gridding, Base & Contour Mapping, and the Geostatistical Analyses tools.
- Extensive library of proprietary programs that automate data manipulation, model development, and output generation processes making our models uniquely cost effective and accessible to project teams.
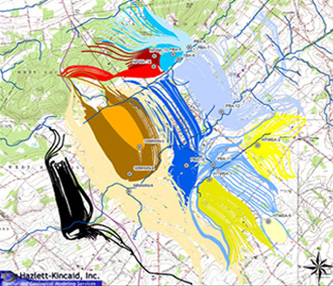
Capture Zone Delineation
- Numerical groundwater flow modeling to define aquifer vulnerability and well head protection zones.
- 2D & 3D particle tracking to delineate well capture zones in unconfined aquifers and specific recharge areas in confined aquifers.
- Surface water modeling to define watershed flows and assess hydraulic requirements for engineered structures.
- Extensive experience in modeling flow through karst, fractured rock, and extremely heterogeneous aquifers.
- Use numerous hydrologic modeling codes: MODFLOW-GMS, MODFLOW-Groundwater Vistas, FEFLOW, HydroCAD, MT3D, RT3D, and ArcGIS-Spatial Analyst.
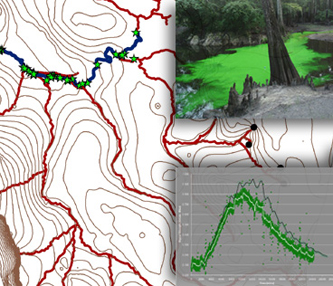
Modeling, Tracing, & Recovery Curve Analysis
- Numerical modeling of groundwater flow using dual-permeability frameworks.
- Delineation of probable conduit pathways, springsheds, and aquifer vulnerability zones.
- Simulation of spring flow response to groundwater pumping and contaminant transport for spring vulnerability assessments.
- Quantitative groundwater tracing using fluorescent dyes, automatic water samples, insitu optical fluorometers, and laboratory spectral fluorescence analysis.
- Interpretation of aquifer hydraulics from quantitative tracer recovery curves.
- Spring, swallet, and karst feature surveys.
- Hydraulic metering and data analysis.
- Cave survey, mapping, & 3D modeling.
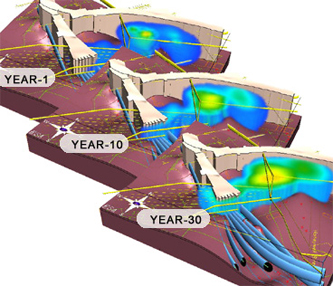
3D Contaminant Transport Model Visualizations
- Numerical simulation of dissolved-phase transport in groundwater using FEFLOW, MT3DMS, & RT3D.
- Transient plume volume estimation and center-of-mass tracking derived from numerical modeling results.
- 2D & 3D visualization of simulated plume configuration and movement using EarthVision.
- Optimization and/or evaluation of remediation system design based on transport scenario analyses.
- Synoptic plume volume estimation & 3D visualization.
- Impacted soil volume calculation & 3D visualization.
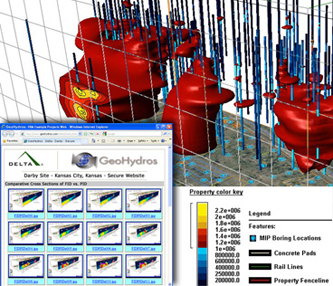
3D FID Model & Project Website Example
- Rapidly and accurately visualize geophysical, MIP, and soil & groundwater contaminant data in 2D & 3D.
- Correlate rapidly collected data (MIP & geophysical) with laboratory analytical and log analysis data to expedite analysis and interpretation.
- Develop data gap analyses to optimize data collection.
- Leverage secure website technologies to share data and model visualizations with project team.
- Automate production of data and model visualization sets and website uploads to reduce turnaround time.
- Standardize figure and presentation templates to reduce time and costs associated with reporting.
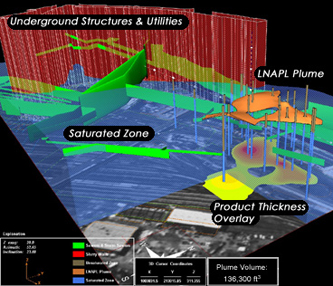
3D LNAPL Plume Delineation & Volumetric Analysis
- 3D LNAPL & DNAPL plume delineations from thickness, concentration, or indicator data.
- Total recoverable LNAPL estimation using Van Genuchten approach and gridded soil parameter datasets.
- Impacted soil volume calculations & removal analyses.
- Automated volume updates using synoptic apparent LNAPL thickness and water table elevation data.
- Animated plume movement analyses along with volume and center-of-mass tracking.
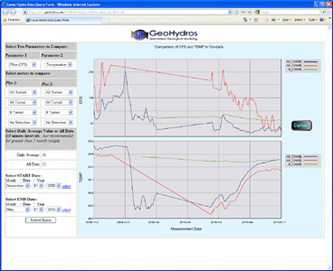
Graphing Tools via Web-Database Interface
- More than 10 years experience in customized database and web-based database interface development.
- Proprietary geospatial database attributes:
- geologic, hydraulic, and contaminant data in a single data model;
- easy-to-use spreadsheet data upload templates;
- queries and reports specifically designed to produce datasets formatted to conform to EarthVision and process modeling input requirements; and
- web-based user interface that allows for data queries that deliver data files and graphical output over the Internet.
- Web-based interface allows anyone on a project team to develop graphical output on the fly from a single data source that provides for a full QA/QC history on all data entries.
- Data model is fully compatible with EPA's STORET and directly accepts transfers from emerging automated laboratory reporting formats.