
ESRI ArcGIS™
ESRI ArcGIS
The GeoHydros Modeling Group has more than 15 years of experience in the use of ESRI ArcGIS software including all versions between ArcView 3.2 and ArcGIS 10.3 as wells as Spatial and 3D Analyst. ArcGIS is an instrumental tool in our workflow wherein we use it for pre-processing geospatial data into the required modeling formats, exchange of data and results between modeling platforms, analysis and interpretation of modeling results, and ultimately for the presentation and delivery of data files and final modeling results. Our group’s expertise includes spatial projection, geo-spatial analysis and database manipulation, visual basic programming, and publication quality map production. Our group has also performed several GIS specific projects ranging from mine green field site selection to city utilities management.
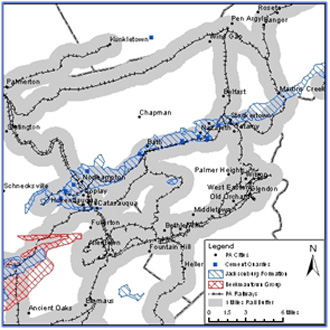
Publication Quality Map Development
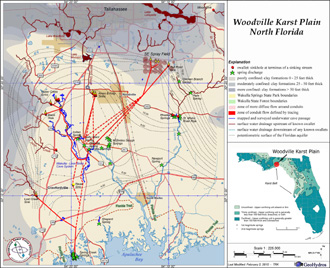
Example: Published map of the
Woodville Karst Plain, Florida
- Efficient and accurate production of quality print-ready maps for reports, articles and independent publication.
- Relating multiple datasets and modeling results to proprietary and publically available basemaps, and aerial photographs.
- Identifying and synthesizing publically available basemap data such as US, State and local roadways, rivers, watershed boundaries, and high resolution aerial photography.
- Porting unprojected or improperly projected maps and images into project projections and datums.
- Post-processing maps with high end image editing or graphic illustration software such as Adobe Photoshop (right).
Interfaceing with Modeling Programs
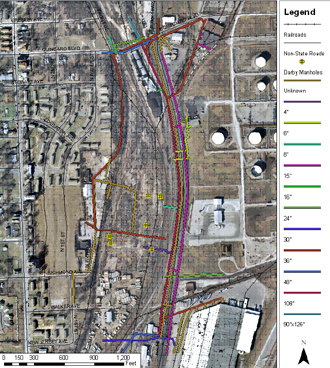
Example: Map of synthesis of city utility data into GIS coverages that can be incorporated into solids and groundwater models or developed into stand-alone applications
- Developed computer programs to integrate results and output from MODFLOW, FEFLOW, and EarthVision into GIS compatible coverages that provide a standardized presentation interface.
- Developed computer programs that allow for rapid updates to model files and GIS output.
- Rapidly updated GIS allows for near real-time data gap analyses that our clients have used to optimize field characterization efforts.
- Developed computer programs to automatically port model output, GIS coverages, and maps to secure project website for rapid delivery to project6 team members.
- Our proprietary automated model and GIS update process significantly improves rapid site characterization (Triad) projects.
Visualization & Analysis
- Adept at porting all manners of model output and data into GIS coverages with standardized projections.
- Use GIS and Spatial Analyst to modify data and model results to facilitate interpretations and dissemination to project team members and regulatory agencies.
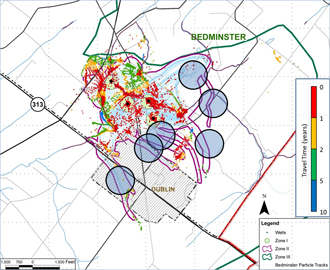
Example: GIS interpretation and visualization of particle tracks
- 2D and 3D particle tracks exported from FEFLOW as polyline layers with data fields for depth of flow and groundwater velocity.
- Intersected paths with the land surface to identify model-defined recharge areas for the wells that were used for vulnerability mapping along with sources of potential contamination such as industrial zones, transportation systems, population centers, and mining regions.
Flow Model Development
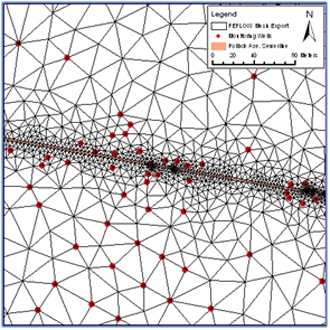
Example: FEEFLOW groundwater flow model mesh created
by importing ArcGIS coverages for monitoring wells and
sewer lines
- Use ArcGIS to delineate key spatial data such as wells, rivers, sewers, and hydrogeologically defensible parameter zones.
- Port hydraulically significant points, polylines, and polygons into MODFLOW or FEFLOW for grid/mesh development (right).
- Export mesh to ArcGIS to facilitate grid/mesh modifications to most accurately represent key features.
- Interpolate hydraulic conductivity, recharge, layer elevation and other hydrologic variables across model layers from points representing known measurement locations.
- Assign boundary condition values such as constant head, constant flux, and pumping / injection rates to model nodes.
- Manipulate parameter values on a zone-by-zone basis in between model runs during model calibration process.
Zone of Interest Delineation
- Develop formulaic approach for delineating specific regions of interest based on combinations of desirable characteristics defined in multiple lines of geo-spatial data.
Example: Quarry green field site selection
- Compiled and synthesized all forms of relevant data including surface and near surface geology, transportation corridors, and municipality boundaries and regulations.
- Developed formula that defined and ranked target zones based on criteria for each dataset (right)
- Developed maps with corresponding data tables from the GIS that were used to facilitate client decisions.
Metadata Production
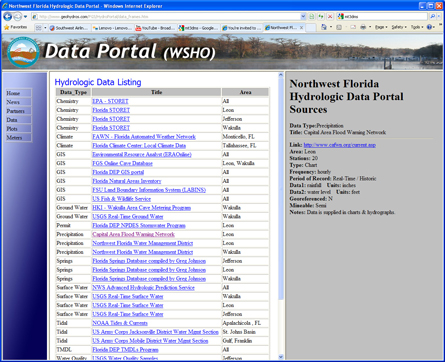
- Develop comprehensive meta-data files for all components of ArcGIS map sets including spatially projected maps and data streams supporting the maps.
- Developed proprietary tools for creating web-accessible metadata for project maps and data as well as publically available but not easy accessible datasets.
Example: Florida Geological Survey Web Data Portal
- Developed browser-based metadata catalog using Javascript and an XML data model http://www.geohydros.com/FGS/HydroPortal/.
- Developed computer program that produces metadata tables that can be updated with changes or added data in minutes.
User Interface Development
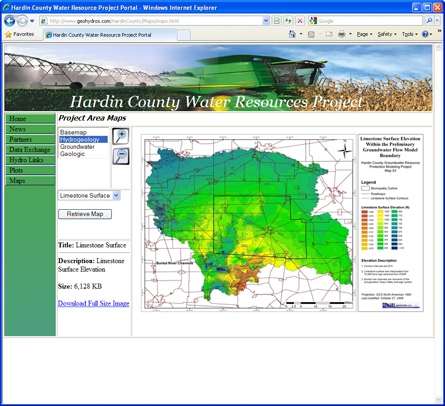
- Developed custom web-applications, online databases and web-based GIS interfaces.
Example: Map Browser
- Web interface that allows users to browse pre-constructed ArcGIS maps as small (quick loading) and large (viewable details) images and download full-scale versions of the maps as pdfs.
- Maps are organized by category and are rendered accessible by drop-down menus off of the Map Browser website.
- Developed Map Browsers for several water resource modeling projects with Coca-Cola, the Florida Geological Survey, and Hardin County, Ohio.
- Main benefits include low cost, ease of use, and that it is rapidly updatable as new maps are created or existing maps are modified.