
EarthVision™
Dynamic Graphics EarthVisionThe GeoHydros Modeling Group has more than 20 years of experience in the use of EarthVision (EV) for solids and parameter modeling, and data visualization. We have extensive experience with the Structure builder, Workflow Manager, Graphic Editor, Formula Processor, Minimum Tension surface and isochore gridding, and the Base & Contour Mapping modules and are adept in the use of most of the software’s other components. In addition, we have developed an extensive library of UNIX shell scripts to automate various data manipulation processes, develop unique stratigraphic and property model development processes, and automate output generation and image website production. We’ve enjoyed numerous opportunities to work with Dynamic Graphics Inc. (DGI) technical support staff to develop modeling processes and have been invited by DGI to lecture on our modeling work and processes at their EV user meetings.
Complex Fault Blocks & VolcanicTuff
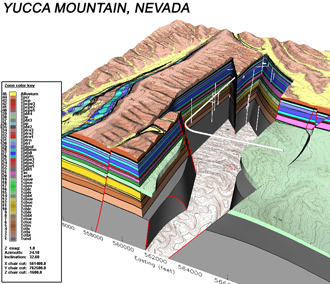
Example: Yucca Mountain Project -
Geologic Framework Model
- 31 square kilometers (12 square miles)
- 42 stratigraphic units of variable thickness positioned across eighteen normal fault blocks
- 6-mile horizontal tunnel ~25 feet in diameter
- Constructed from published geologic maps, 101 boreholes, information from tunnel data, and measured stratigraphic sections from outcrop areas.
Example: Nevada Test Site
- Developing and revising geologic framework models to support contaminant transport modeling in the corrective action units.
Dipping Hydrostratigraphic Units & Intrusions
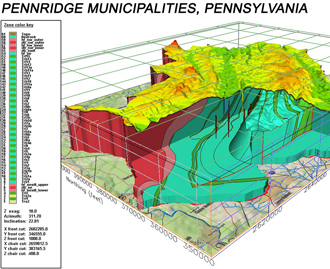
Example: Pennridge Aquifer Protection Model,
Bucks County PA
- Developed comprehensive geologic framework model to support groundwater flow model designed to delineate well capture zones and aquifer vulnerability areas.
- Model simulated 60 interbedded lithologic units of varying thickness, geometry, and permeability that are structurally tilted in a synclinal basin, faulted at one end, and intruded by a diabase.
- Developed model using strike and dip information and outcrop boundaries obtained from published geologic maps.
- Exported framework to FEFLOW for groundwater flow modeling.
Severely Heterogeneous Contaminanted 3D Aquifer Systems
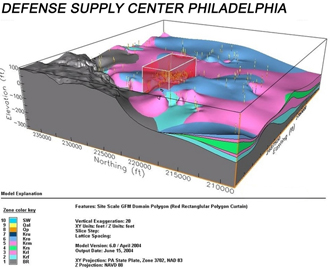
Example: Defense Supply Center
Philadelphia, Pennsylvania
- Combined site- and regional-scale geologic framework model supporting groundwater flow and transport models.
- Integrated stratigraphic, lithologic, and electrical conductivity data from more than 1000 boreholes.
- 32 mi2 (regional-scale) and 4.75 mi2 (site-scale).
- 8 discontinuous and variably thick stratigraphic units over an eroded bedrock surface.
- Heterogeneous lithologies in upper 4 zones modeled probabilistically and independently of stratigraphy.
- Distribution of LNAPL, soil contamination, and dissolved phase contamination relative to geology and underground structures.
Siesmically Defined Karstic Flow Paths
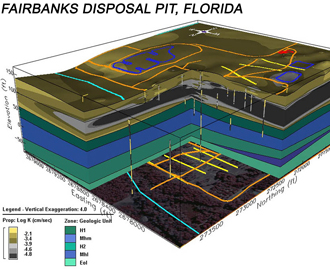
Example: Fairbanks Disposal Pits,
Gainesville Florida
- Delineated structural controls on possible vertical hydraulic communication between a surficial contaminated zone and underlying Floridan aquifer.
- Used borehole and seismic data to model confining layer surfaces relative to a heterogeneous distribution of soils.
- Identified contaminant migration pathways based on truncations in confining layers associated with karstic depressions.
- Six stratigraphic zones and variation in hydraulic conductivity defined by discrete soil sampled intervals.
3D Contaminant Plume Movement
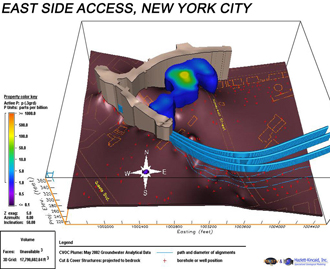
Example: East Side Access Project,
Long Island New York
- Imported results from 3D contaminant transport model at 30 time-steps from FEFLOW to an EarthVision geologic framework model of stratigraphic units and underground engineered structures (right).
- Developed computer scripts to automate visualization modeling, output generation, and export to a secure project website.
- Visualization models used to track plume volumes at critical concentration levels, and center of mass movement.
- Animations created to visualize predicted plume movement over time under build and no-build scenarios for every model run to facilitate effective interpretation and evaluation.
Probablistic Zone / Parameter Delineation
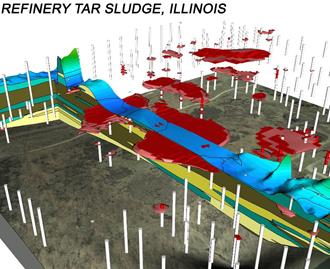
Example: Refinery Tar Sludge, Illinois
Lithographic and Parameter Model
- Developed probabilistic method similar to indicator kriging to define the 3D distribution of zones or parameters in the subsurface based on observation data.
- Method is useful for both lithologic zone delineations and non-aqueous phase contaminant delineations such as tar sludge (right) or LNAPL.
- Process defines the extent of the zone or contaminant at specific confidence levels i.e. 90% confidence, 75%, 50%, etc.
- Process is scripted to facilitate rapid updates with new or reinterpreted data.
- Developed visualization modeling scripts to rapidly and automatically generate image output and volumetric reports that are uploaded to a secure project website.
Geophysical & GeoProbe-MIP Data Visualization
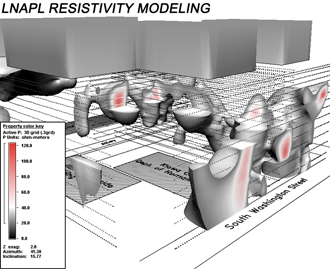
Example: 3D visualizations of resistivity defined
LNAPL plumes relative to site features
- Developed visualization modeling scripts to automatically read geophysical and GeoProbe-MIP data files.
- Integrate 3D grids with variable grid spacings to account for data that becomes progressively sparse in the z-direction.
- Initial modeling used to constrain interpretive contouring controls and establish standard visualization sets that include key underground and surface structures.
- Automate model generation, visualization production, and volumetric reporting and upload to a secure project website.
- Models and output processed in hours after receiving field data allowing modeling to help guide field characterization efforts.
- Right – LNAPL defined by surface resistivity relative to building locations on the surface.
Structural Modeling for Mining & Quarrying
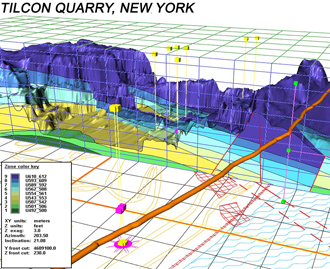
Example: Tilcon Quarry, New York – 3D model identification
of fault zones connecting quarry with Hudson River
- Model faults, fault zones, and fault displacements in addition to stratigraphic units, and land surface elevations.
- Use multiple data sources including borehole logs, geophysical surveys, and outcrop mapping.
- Can also incorporate mineralogic zonation within stratigraphic units and fault blocks using parameter data.
- Use models to identify target zones, infiltration problems, structural assessments, and as the framework for subsequent groundwater flow modeling used for environmental impact assessments.
- Right – 3D model of the Tilcon Quaryadjacent to the Hudson River in New York that was used to delineate areas in the river contributing infiltration to the quary.
Cave & Conduit Modeling
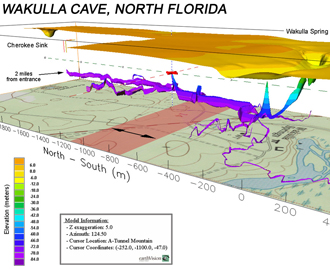
Example: Wakulla Cave, North Florida –
Hydrogeologic Framework Model
- Developed 3D structural and parametric model of complex subsurface features such as karstic caves (right) using non-standard data such as cave survey data.
- Used models to relate underground features to land surface locations to guide decisions on land-use and development.
- Used models as platform to evaluate trends in measured parameters such as water chemistry, flow, etc.
- Used modes for public presentations to increase awareness of environmental vulnerability as well as development risks.
- Used models to support detailed flow and transport assessments.