
NAPL Characterization
| PROJECT NAME & LOCATION | DATE STARTED | DATE COMPLETED | |||||
| DSCP Groundwater Remediation Philadelphia, PA |
June, 2001 | June, 2004 |
| ACTIVITY TITLE | APPROXIMATE CONTRACT VALUE | |||
| LNAPL Modeling | ~$30,000 |
| CLIENT NAME & ADDRESS | TECHNICAL CONTACT | |||
| Brian Blanchard / (215) 702-4066 Tetra Tech EC, Inc. / Langhorne, PA Brian.Blanchard@tteci.com |
DESC / Hasan Dogrul / hasananddebbie@aol.com TTEC / Derek Pinkham / (215) 702-4070 Derek.Pinkham@tteci.com |
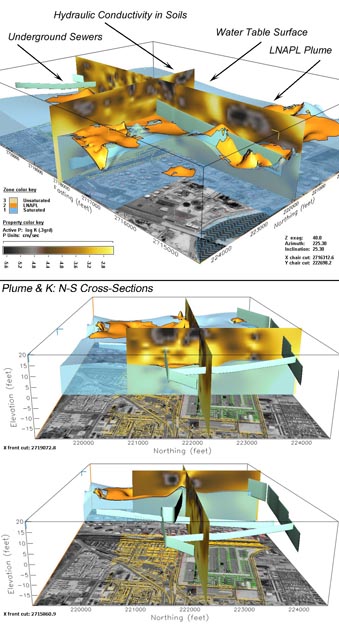
3D Perspectives of LNAPL Plume Morphology relative to the Water Table Surface, Sewers, and Hydraulic Conductivity
The Defense Energy Support Center (DESC), in collaboration with Tetra Tech EC, contracted GeoHydros to construct a comprehensive geological framework model (GFM) for the Defense Supply Center Philadelphia (DSCP) and use the model as the basis for groundwater flow and contaminant transport assessments. The primary purpose of the GFM was to synthesize disparate datasets describing the Site and regional geology, free-phase, dissolved-phase and soil contaminant distributions, and the location and orientation of underground structures into a 3D, visually and digitally query-able model that would provide the basis for subsequent groundwater flow and contaminant transport simulations.
One component of this model was a light non-aqueous phase liquid (LNAPL) plume located on top of the shallow groundwater surface underlying the DSCP facility and extending beyond the property to the south and west where southward migration is limited by the presence of large combined sewer/storm sewer system. Preliminary estimates of plume volume ranged from 1-2 million gallons.
Our objective was to develop an automated method of visualizing and estimating the plume volume on a quarterly basis using standard synoptic liquid level data. 3D visualizations were created using 2D grids representing the synoptic water table surface and apparent product thickness, stacking the grids in the GFM, designing visualization sets showing the plume morphology relative to the water table surface, underground structures, and lithology, and then writing scripts to automatically generate the visualization sets using any synoptic input dataset.
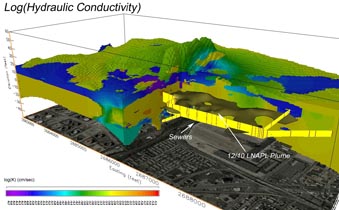
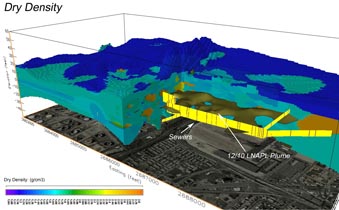
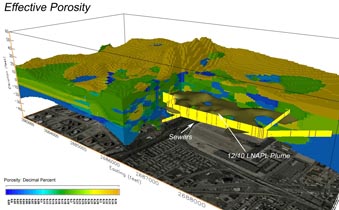
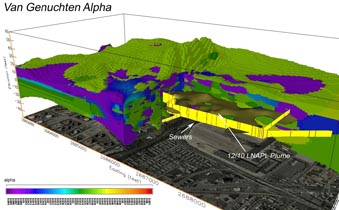
Plume volume estimates utilized the Van Genuchten method supported by the water table surface and LNAPL thickness grids contained in the GFM as well as 3D parameter grids created for each of the Van Genuchten soil parameters from a single-point-in-time soil dataset. The 3D parameter grids were created for the region encompassed by the LNAPL plume at a resolution of 50x50x5 feet. The grids were then processed with specially developed software that applied the Van Genuchten method to estimate the recoverable LNAPL volume at each 3D grid cell for each of the modeled synoptic periods. The total volume of recoverable LNAPL was then computed by summing the values obtained for each grid cell. The method was scripted such that the estimates could be rapidly reproduced for each synoptic dataset. The results tightened the initial estimate of total recoverable hydrocarbons to be between 1 and 1.5 million gallons and revealed a decline in volume over time as a result of LNAPL recovery activities.
We developed the method, visualizations, and plume volume estimates on time and on budget and the method was successfully implemented. Project management and the Client regarded the plume volume estimation method as a more accurate means of estimating the effectiveness of the LNAPL recovery system than previously used methods that relied on evaluating historic LNAPL thickness maps. The results were used internally and presented to the public.