
Groundwater Flow Modeling
| PROJECT NAME & LOCATION | DATE STARTED | DATE COMPLETED | |||||
| Simulation of 3D Groundwater Flow, Los Angeles Co. CA | January, 2012 | July, 2012 |
| ACTIVITY TITLE | APPROXIMATE CONTRACT VALUE | |||
| Geological & Groundwater Flow Modeling | $60,000 |
| CLIENT NAME & ADDRESS | TECHNICAL CONTACT | |||
| ERM 1277 Treat Boulevard, Suite 500 Walnut Creek, CA 94597 |
ERM 1277 Treat Boulevard, Suite 500 Walnut Creek, CA 94597 |
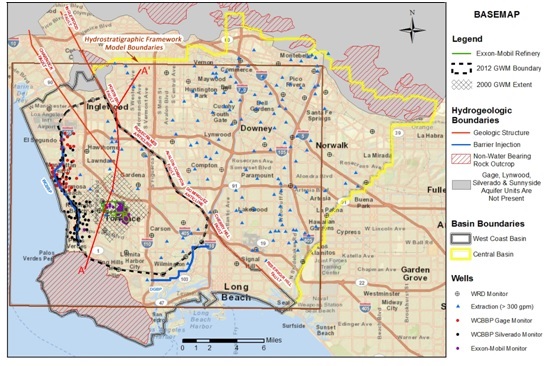
Groundwater model domains and boundaries of the hydrostratigraphic framework model constructed to provide the conceptual basis for the revised groundwater model, boundaries of the Central and West Coast Basins, lines representing the West Coast Basin Barrier Project (WCBBP) and Dominguez Gap Barrier Project (DGBP) injection wells, and the monitoring and injection wells from which data was used for model construction and calibration.
The GWM simulated a 3D flow system consisting of three aquifers: Gage/Gardena, Lynnwood, and Silverado, variably separated by discontinuous aquicludes and deformed in the northeast by the Charnock Fault and the Newport-Inglewood Uplift. The model was constructed in FEFLOW™ using geologic data compiled from more than 300 onsite and offsite boreholes describing hydrostratigraphic contacts and lithology; average head data compiled from more than 10,000 water level measurements collected from 198 monitoring wells in the Gage aquifer, 15 wells in the Lynnwood aquifer, and 39 wells in the Silverado aquifer; and average extraction rates for 136 water supply and recovery wells.
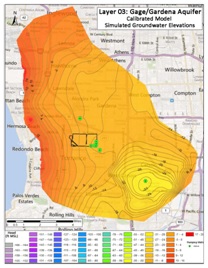
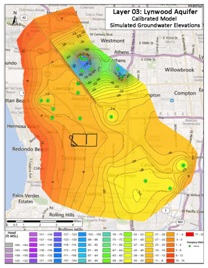
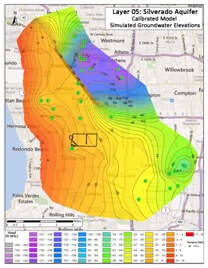
The model calibrated to within +/- 0.4
feet of the observed head range at 8 of 11 Silverado aquifer
calibration wells (73%), at 11 of 15 Lynwood
aquifer calibration wells (73%), and at 145 of 179
Gage-Gardena aquifer calibration wells (81%) for a
total of 164 of 205 (80%) calibration wells. The remaining
wells were either close to the calibration targets, determined not to
be indicative of head in the simulated aquifers, or not considered to
significantly impact the simulated extraction well capture zones.
Five scenario analyses were performed to define and evaluate well
capture zones under different hydraulic and pumping rate conditions: 1)
anticipated normal rates, 2) anticipated minimum rates, 3) anticipated
and design maximum rates, 4) delineation of groundwater
travel-time-based estimates for contaminant movement and 5) an
evaluation of contaminant capture at various pumping rates.
There are a few areas where the design of the GWM
could be modified to produce a better fit to the steady-state
calibration dataset and / or make scenario results more defensible. The
most significant improvement would be the inclusion of well depth and
screened interval data for all of the extraction wells within the model
domain for which no data was available during this effort. WRD has a
web-based interactive well search system which reportedly allows users
access to all known well development data in the West Coast and Central
Basins. With these data, any incorrect well placement assumptions could
be corrected increasing the accuracy and defensibility of the simulated
flow field and capture zones.
Model calibration could also be improved by spending more time on the
delineation of aquifer heterogeneity near the regional WRD monitoring
locations. More accurately calibrating to all regional wells would
improve the reliability of the simulated capture zone boundaries. This
would be particularly relevant to efforts aimed at minimizing
extraction rates and/or optimizing pumping designs while maintaining
plume capture.
Model predictions of travel-time could be improved by more closely
analyzing the three very high conductivity zones (one in each aquifer
layer) that were defined by PEST. Though the flow directions and plume
capture predicted by the model should remain relatively unchanged
because the calibration in these regions is good and flow direction and
therefore capture are defined by heads, the high conductivity zones
could be generating over-predicted travel-times through these areas. To
evaluate this, a sensitivity analysis should be performed in order to
determine if equally good calibration could be achieved with lower
assigned conductivities in these zones.
Finally, we could expand the calibration dataset, and therefore
increase the model’s defensibility, if we could gain access to head
measurements recorded by the WCBBP for their monitoring well system. We
were only able to find head measurements from this system from one
measurement period. However, we did find references to semi-annual
system reports and contour maps developed on this measurement cycle.
Collection of head data from this system for the steady-state time
period would allow us to develop steady-state values for these wells
and use them to better control the PEST estimations.