
Geologic Modeling
| PROJECT NAME & LOCATION | DATE STARTED | DATE COMPLETED | |||||
| Stratigraphic & Fault Modeling Undisclosed |
November, 2009 | Currently Active |
| ACTIVITY TITLE | APPROXIMATE CONTRACT VALUE | |||
| Geologic Modeling | NA |
| CLIENT NAME & ADDRESS | TECHNICAL CONTACT | |||
| Navarro-Intera LLC P.O. Box 98952 Las Vegas, Nevada 89193-8952 |
Greg Ruskauff P.Hg. (702) 295-9694 Greg.Ruskauff@nv.doe.gov |
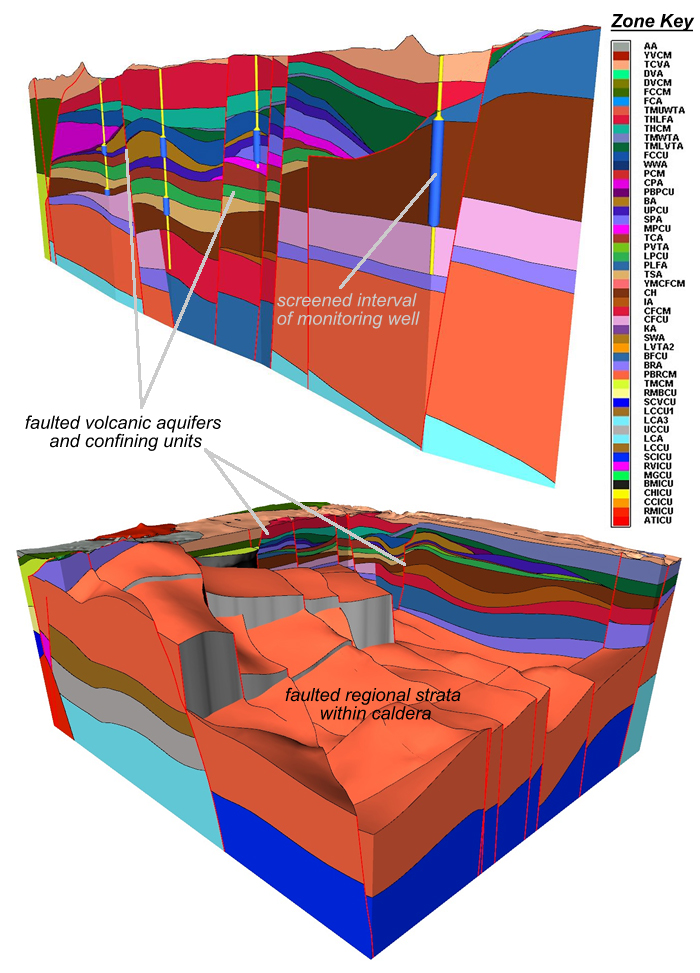
(Top) Fence diagram showing the faulted hydrostratigraphic units (HSU) relative to the screened interval in select monitoring wells.
(Bottom) Chair-cut perspective view of the model showing the faulted surface of a key HSU relative to the placement and thickness of key aquifers and confining units.
Data from numerous sources were incorporated to produce the HFMs including surficial geologic maps, borehole logs, interpretive cross-sections, geophysical survey results and extent contours of the hydostratigraphic units (HSUs). The largest of the models incorporates an area of more than 2700 km2 (1048 mi2), a volume of 25,380 km3 (6100 mi3), and 53 stratigraphic units of variable thickness positioned within 101 fault blocks.
Our model development process utilizes isochore grids stacked between select reference horizons, which ensures that the HSUs will balance correctly across the faults where appropriate while allowing fault offsets to be assigned according to both data and professional judgement. We developed an iterative stacking process that corrects simulated surface elevations to data derived from partially penetrating boreholes and outcrops sequentially as the model is constructed from the bottom up while the error at each iteration is distributed statistically into the underlying thickness and elevation grids. The result of this process is a model that honors both thickness and elevation data as defined by boreholes and outcrops.
Fault and fault offset modeling was performed through the use of 2D fault and reference horizon grids. Fault trends and dips were assigned according to orientation, strike and dip information derived from geologic maps. Polygons and a fault tree and were then constructed to define how the fault grids intersect and terminate in 2D and 3D. The most continuous HSU surfaces were then evaluated for use as reference horizons, which were modeled as 2D surfaces from borehole and outcrop data using control points where necessary to establish geologically reasonable fault offsets. The fault offsets for the intervening units defined with isochore grids either assumed the lower reference horizon values or values representing a gradation between overlying and underlying reference horizons. The latter strategy was used primarily to simulate concurrent deposition and fault growth as has been conceptualized for parts of the model domain.
After defining the structural and hydrostratigraphic framework, we have simulated the distribution of hydrogeologic properties within an individual HSU or groups of HSUs through the use of 3D property modeling. The property models are being used to explore multiple realizations of the 3D distribution of properties (lithology, rock chemistry, porosity, etc) within a geologic zone, as either indicator grids, which describe discontinuous geologic characteristics, or deterministic interpolations, which are used to describe properties thought to have a a continuous distribution within the rock unit(s).
One thing that sets us apart from other geologic modelers is our ability to automate model construction and output production processes. This is done by relying solely on datasets (borehole, outcrop, interpretive, and control) and scripting every step of the model construction process as well as the production of structural surface and isochore maps, cross-sections, 3D perspective views, slice-through animations, QA/QC charts and tables. This methodology allows us to quickly accommodate data changes, interpretation refinements and even structural reinterpretations, while producing a complete set of output and QA/QC checks for every iteration. Our automation processes also allow us to quickly produce sub-domain models, model queries of specific areas and to migrate the models from Earthvision to a number of different flow modeling and visualization software platforms.
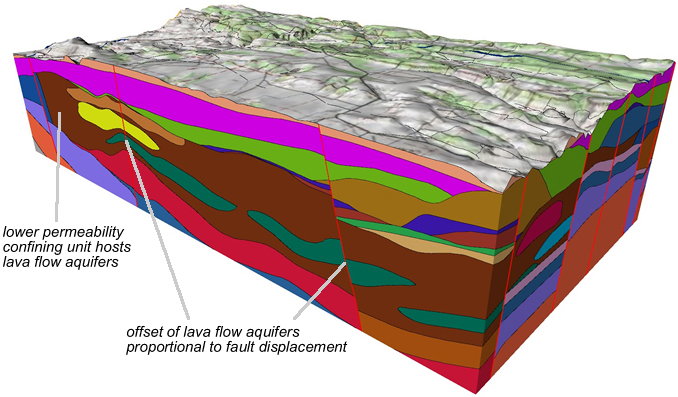
3D perspective of a sub-domain of the HFM showing the simulation of discrete lava flow aquifers as indicator-property models within a structural volume bounded by faults and surfaces within the HFM.
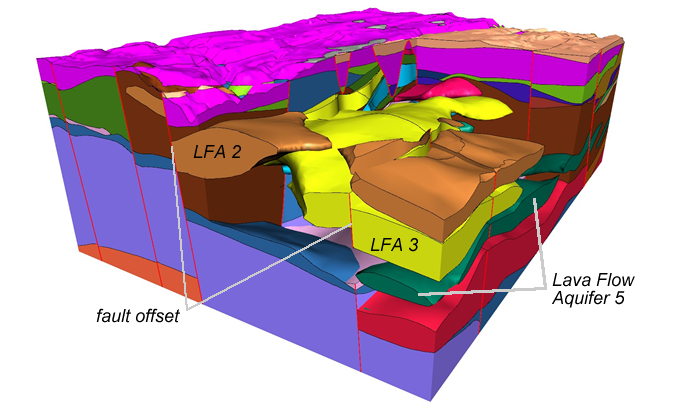
View of Lava Flow Aquifers with hydrostratigraphy sliced away showing the relationship of LFA volumes to each other and potential hydraulic communicationacross fault offsets.
We have met or exceeded expectations in all aspects of our work on this project to-date. Though some phases of the modeling have taken longer than expected, we have consistently produced the expected results within our allocated budget. The rapidity with which we have been able to produce visualizations of complex model areas and data have led to an expansion of our work into other aspects of the project. These expansions have, at times, caused delays in modeling which have contributed to but not been the sole cause of project schedule delays. Generally, we are extremely proud of our work on this project and look forward to applying lessons-learned here to future geologic modeling projects.